Skagit 2045 Public Engagement
In 2020, Skagit Council of Governments began the update process for the Skagit 2040 Regional Transportation Plan. The new plan, entitled Skagit 2045, necessitated public outreach and involvement to understand community preferences and needs for regional transportation improvements. Due to the COVID-19 pandemic, SCOG planning staff identified a need to transition public involvement for the plan update to an online format.
I led the virtual public engagement process for this plan update by developing the Skagit 2045 website (no longer available) with multiple input mechanisms, namely a survey hosted through the Survey Hero platform, and an interactive ArcGIS Online map using the “Crowdsource Reporter” template to allow the public to identify transportation issues.
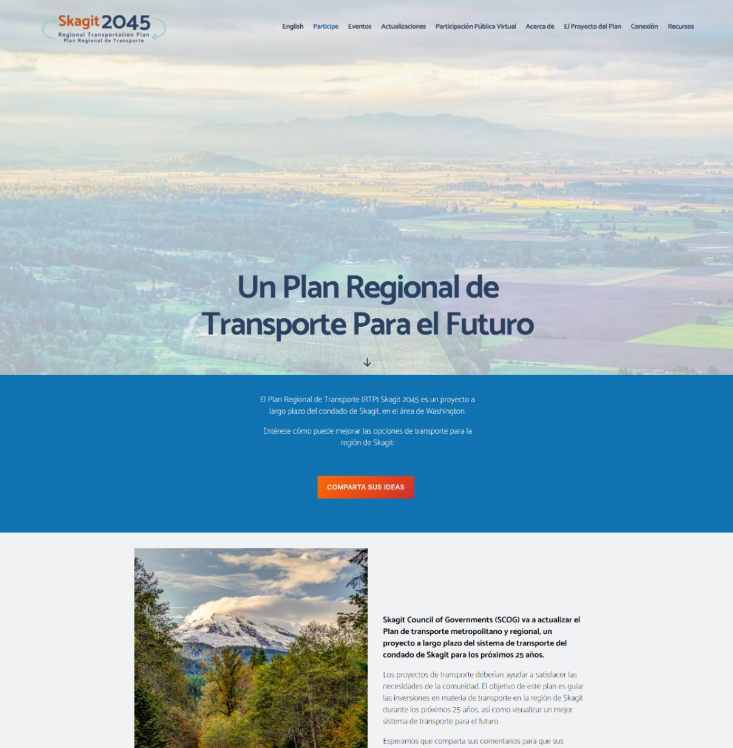 Spanish language view of the Skagit 2045 website
After the Survey Hero survey concluded, I visualized survey results in Power BI. I embedded these dashboards in an ArcGIS Online Story Map format to allow for easy communication of the survey results:
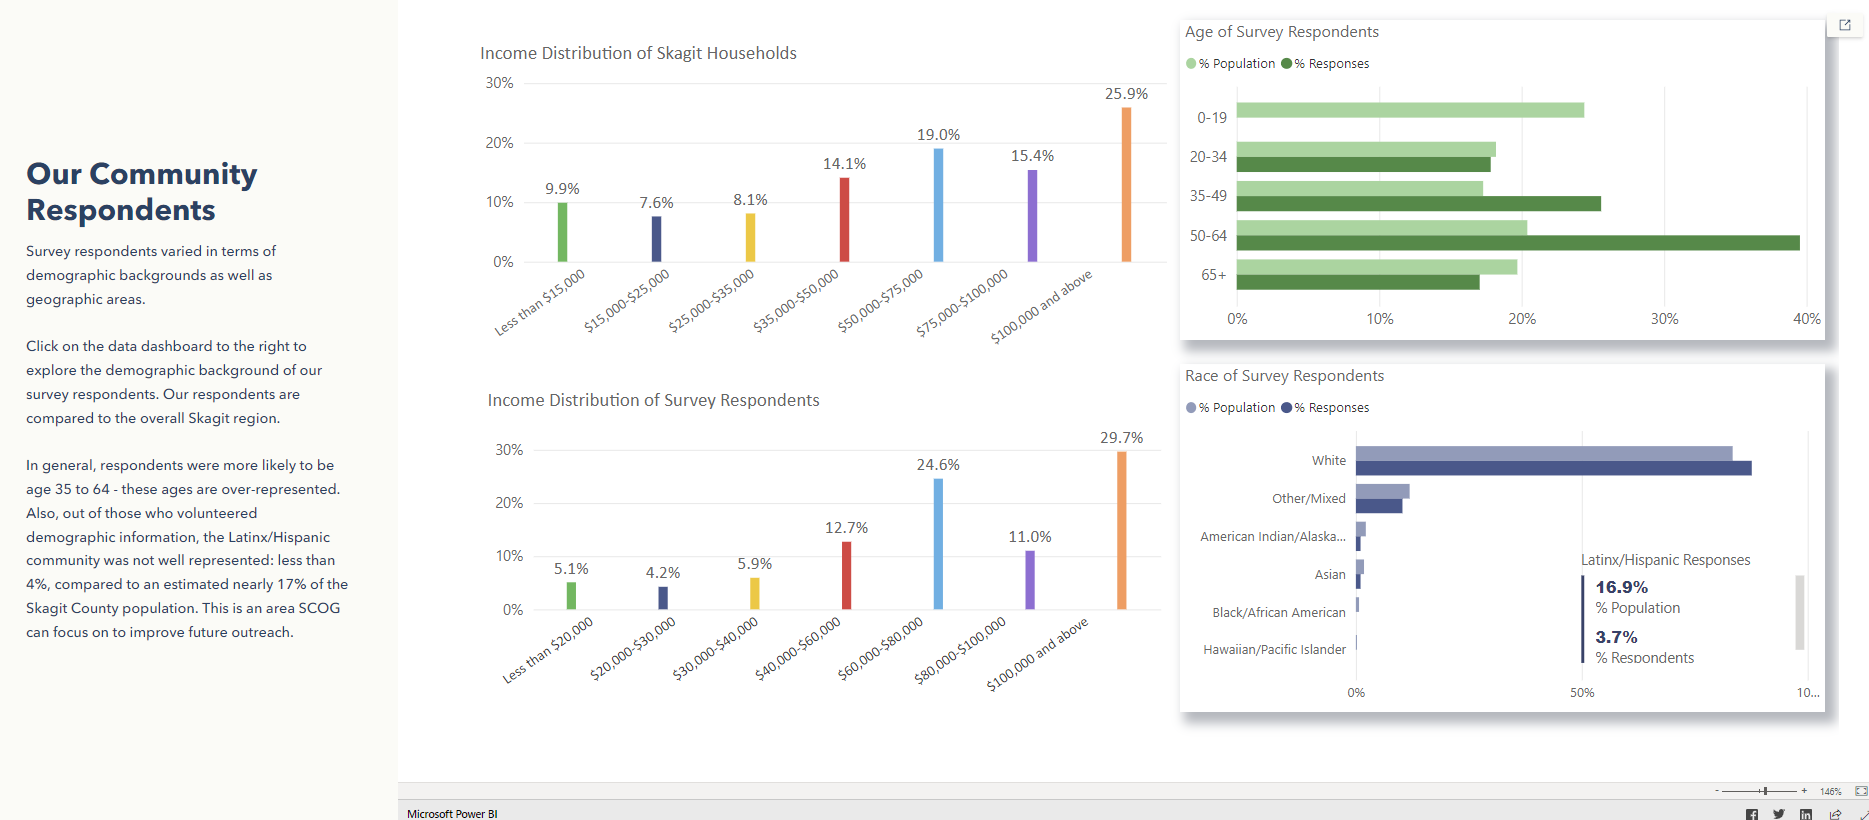 Visualization of survey respondent demographics
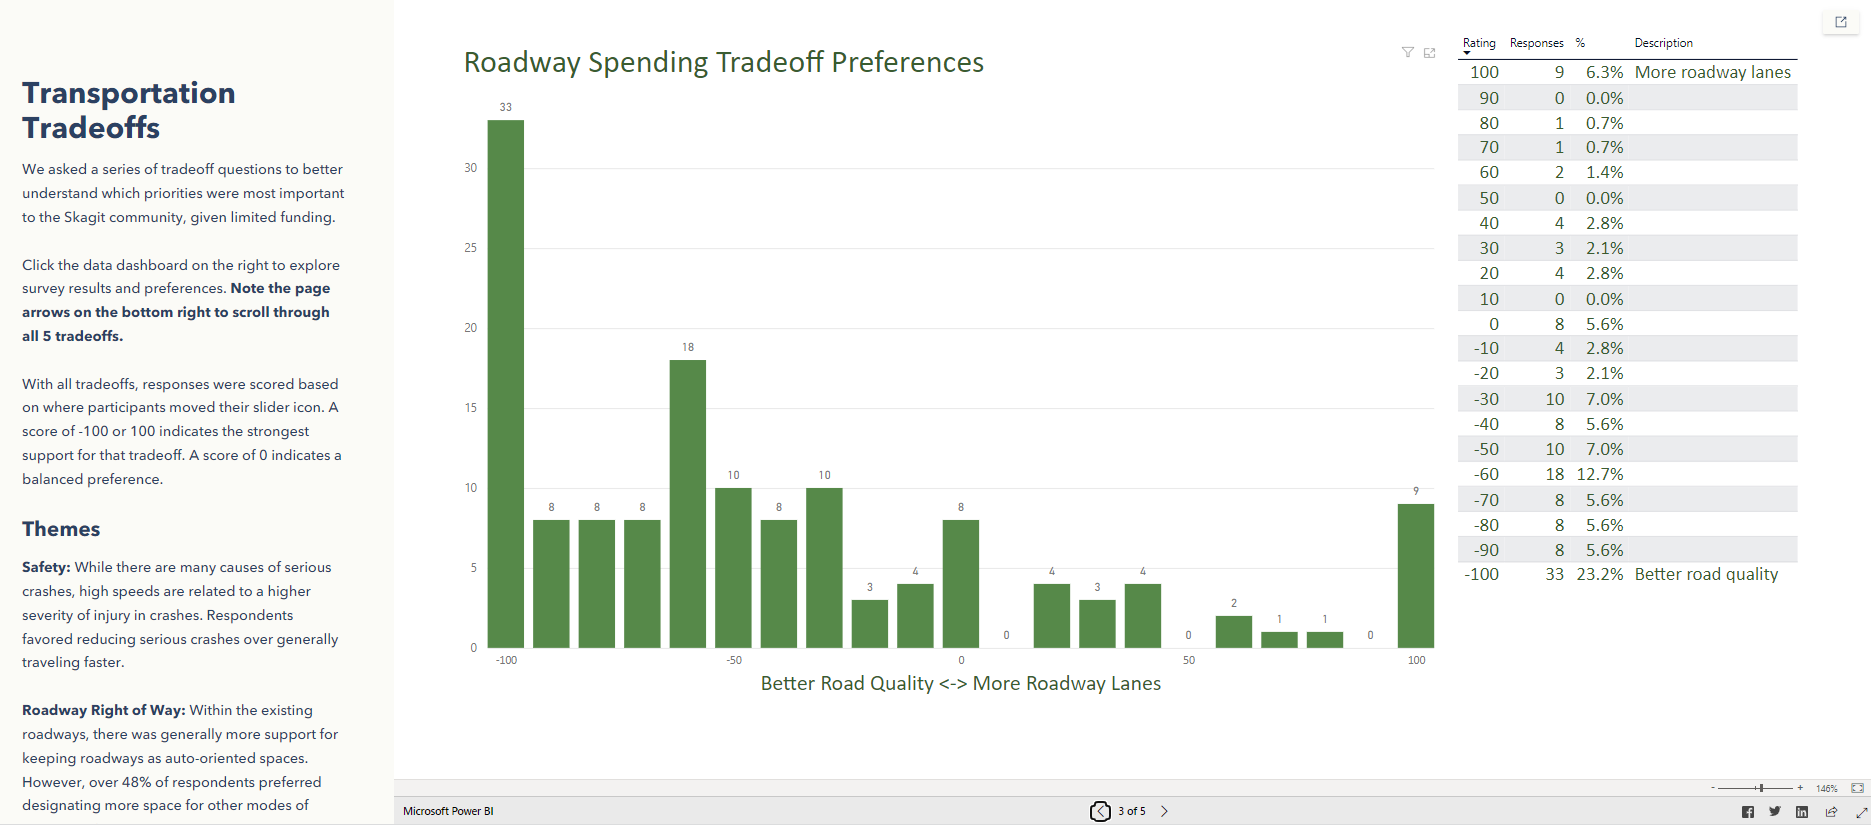 Visualization of responses to survey tradeoff questions
In Power BI, I piloted a visualization technique using the results of a thematic analysis of qualitative survey comments. Survey respondents were assigned anonymous IDs and the themes associated with their comments were aggregated. By using a network visualization format, the Story Map audience could explore the interrelated nature of comment themes in the survey. More frequent comment themes, such as those relating to SR 20 in Skagit County, were represented with gradually larger spheres. The network naturally organized itself based on how multiple comment themes were related to specific commenters.
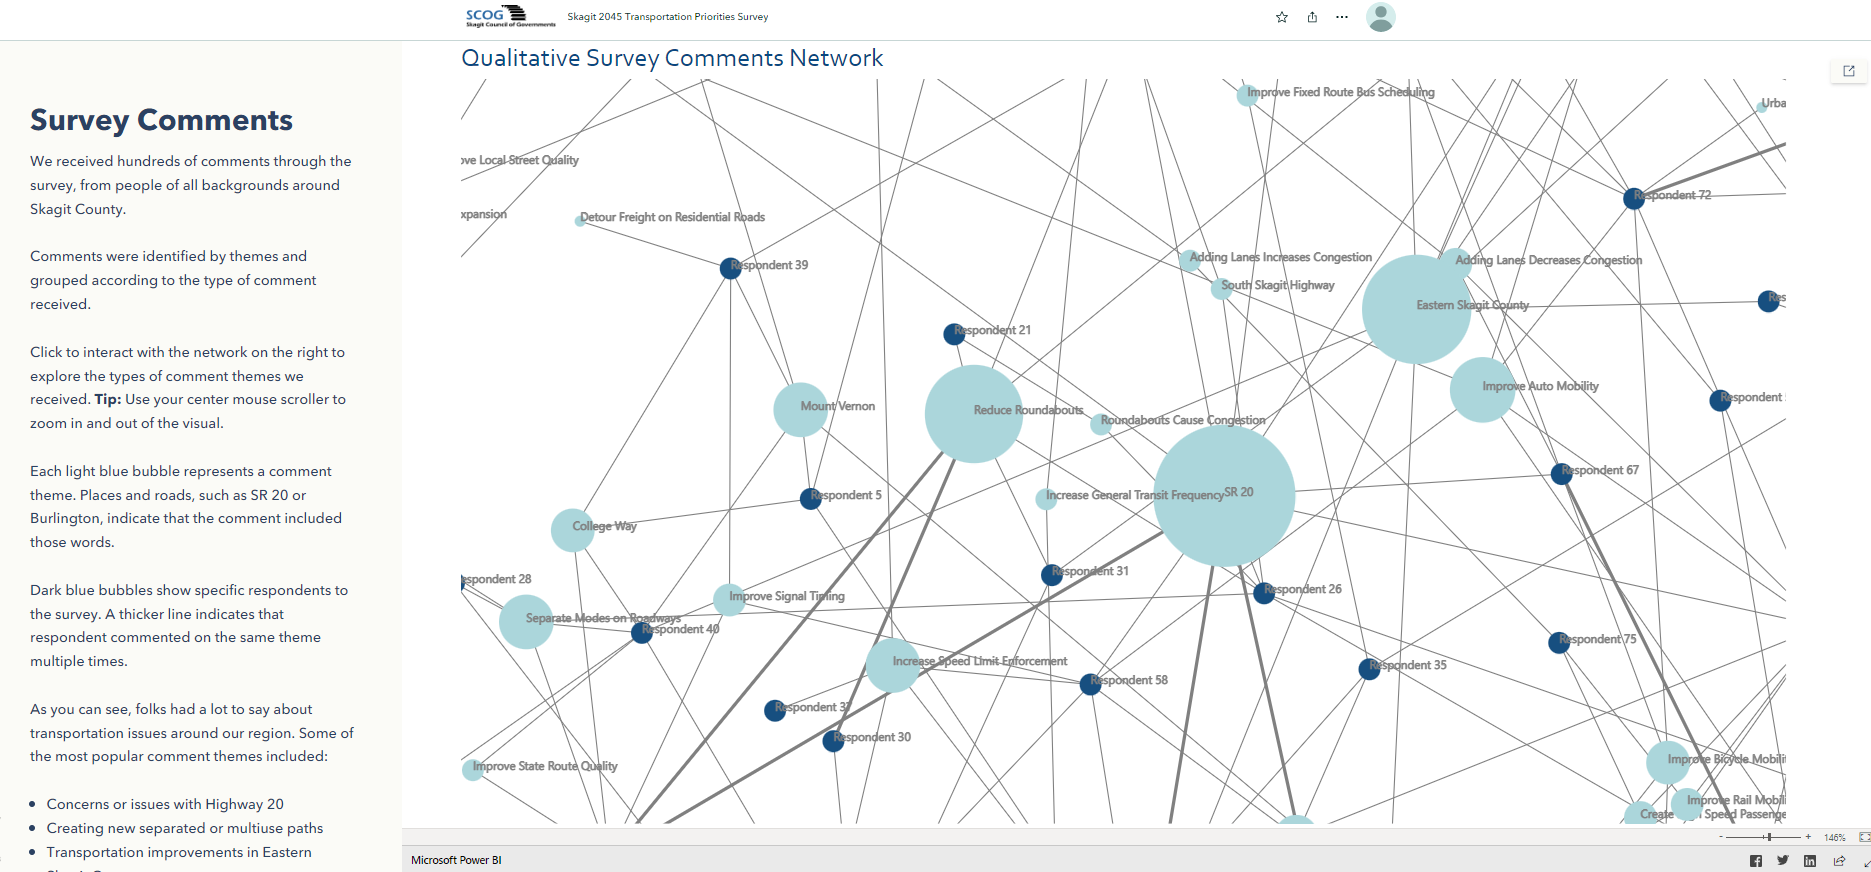 Visualization of qualitative comments in a network