I-5 Operations & Demand Management Analysis - Public Survey
In October 2021, WSDOT worked in partnership with the Whatcom Council of Governments to engage the Whatcom County community in understanding transportation challenges and preferred strategies to address congestion and safety issues on the I-5 mainline in Whatcom County. Around 700 survey responses were received through the MetroQuest platform as part of this outreach effort.
I developed the Whatcom I-5 Survey Story Map to communicate survey results to our Metropolitan Planning Organization and local agency partners who continue to work with the Mount Baker area in this corridor planning process. The intent of this Story Map was to create a more interactive alternative to a traditional written report. By using interactive web maps and charts, partners, stakeholders, and the public were able to explore individual survey responses and comments and access specific statistics in a more granular way. Interactive charts were hosted on the StoryMap using ESRI Dashboards.
Charts allowed our planning staff to present information in a variety of different ways:
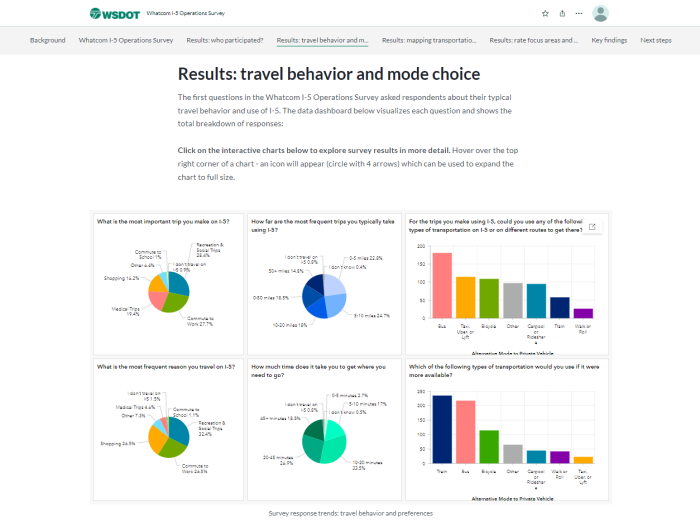 Interactive charts in the Story Map visualizing travel behavior & attitudes based on survey responses
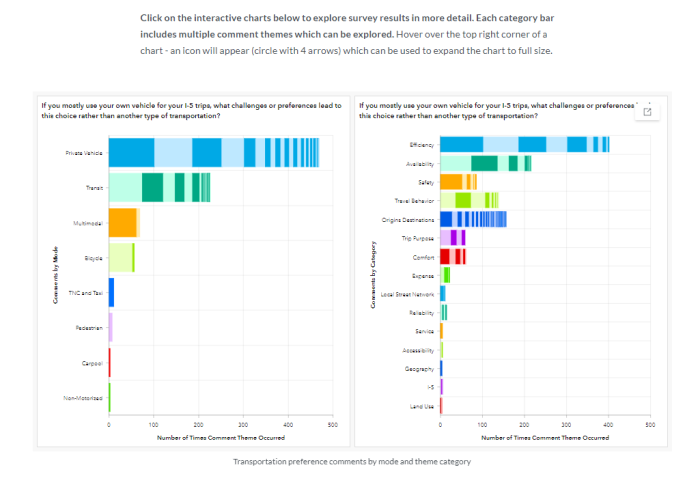
Qualitative comments were analyzed for their content with a thematic analysis. Common themes were aggregated and presented as interactive charts. By clicking on the chart, end users could explore the prevalence of each comment theme:
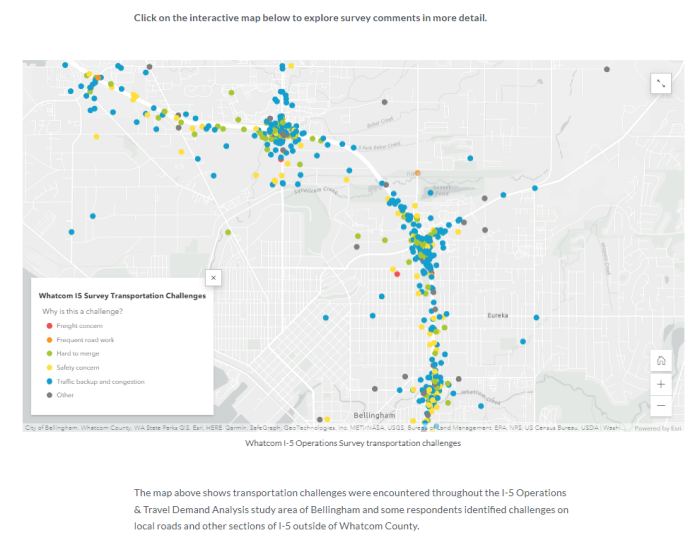
Interactive web maps were used to present demographic and comment data. In MetroQuest, survey respondents were asked to identify their transportation challenges. This point data was categorized based on the type of challenge users indicated. The end user is able to explore specific individual comments associated with each map point: